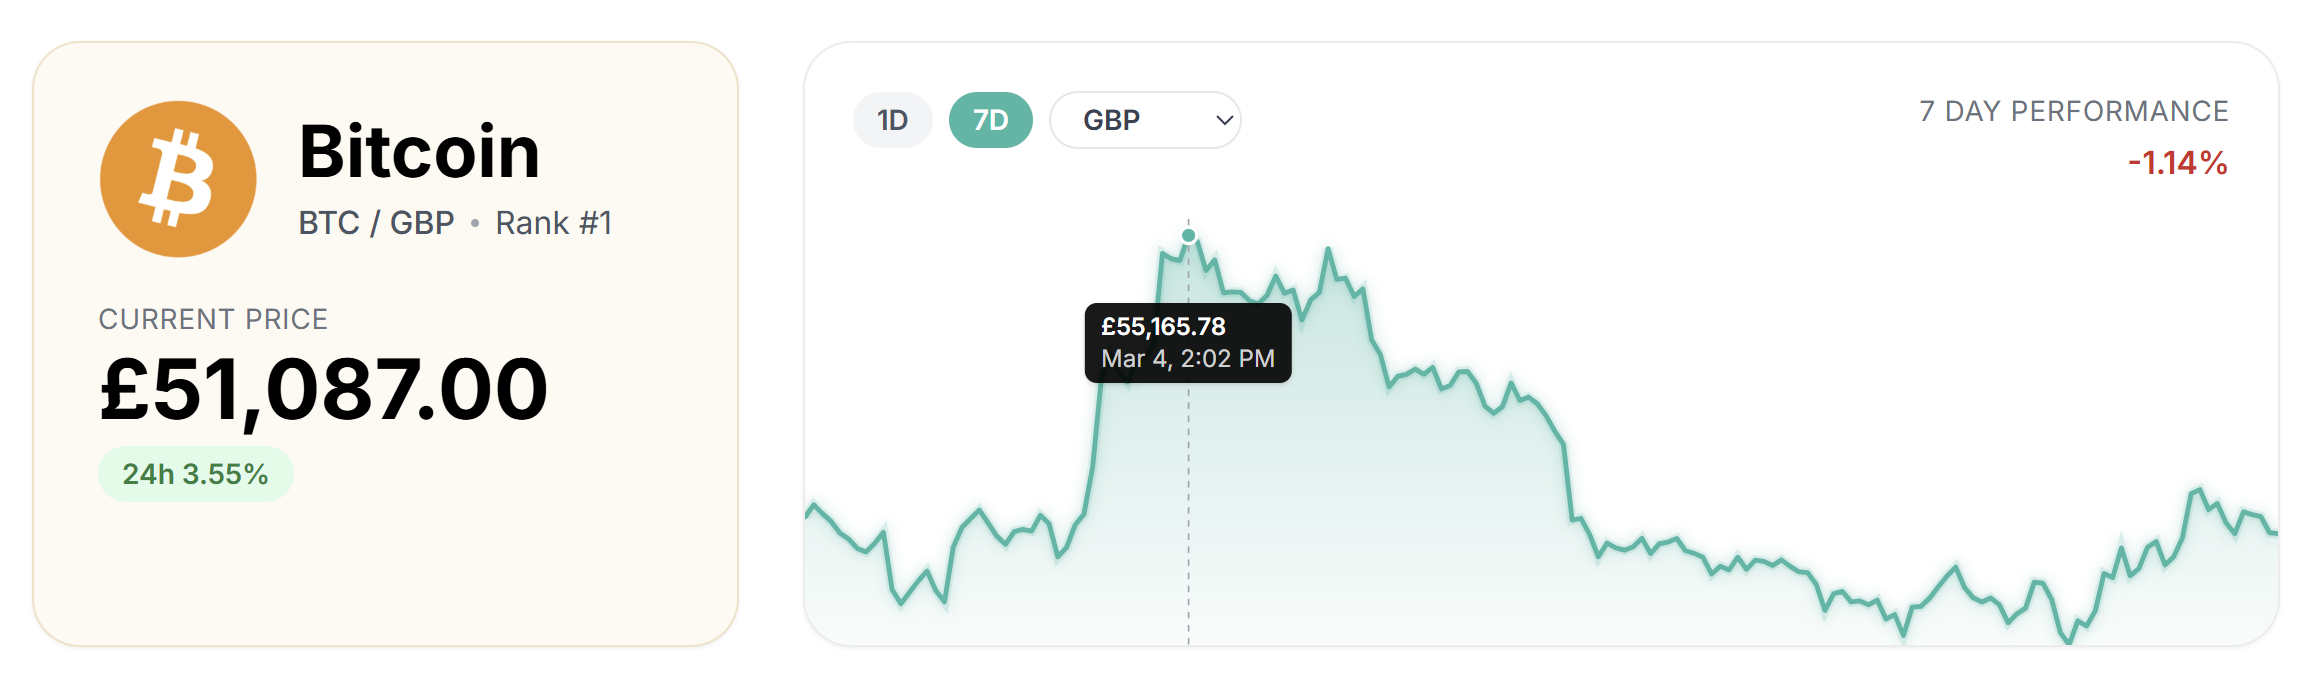


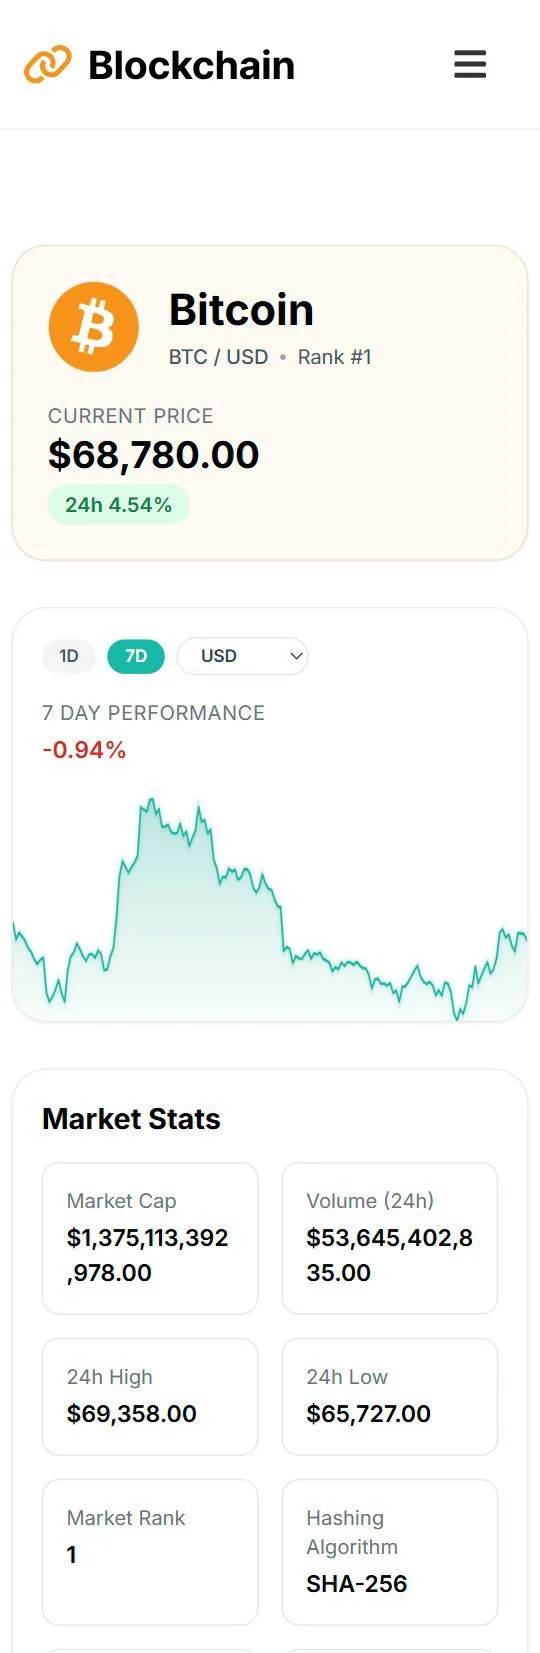
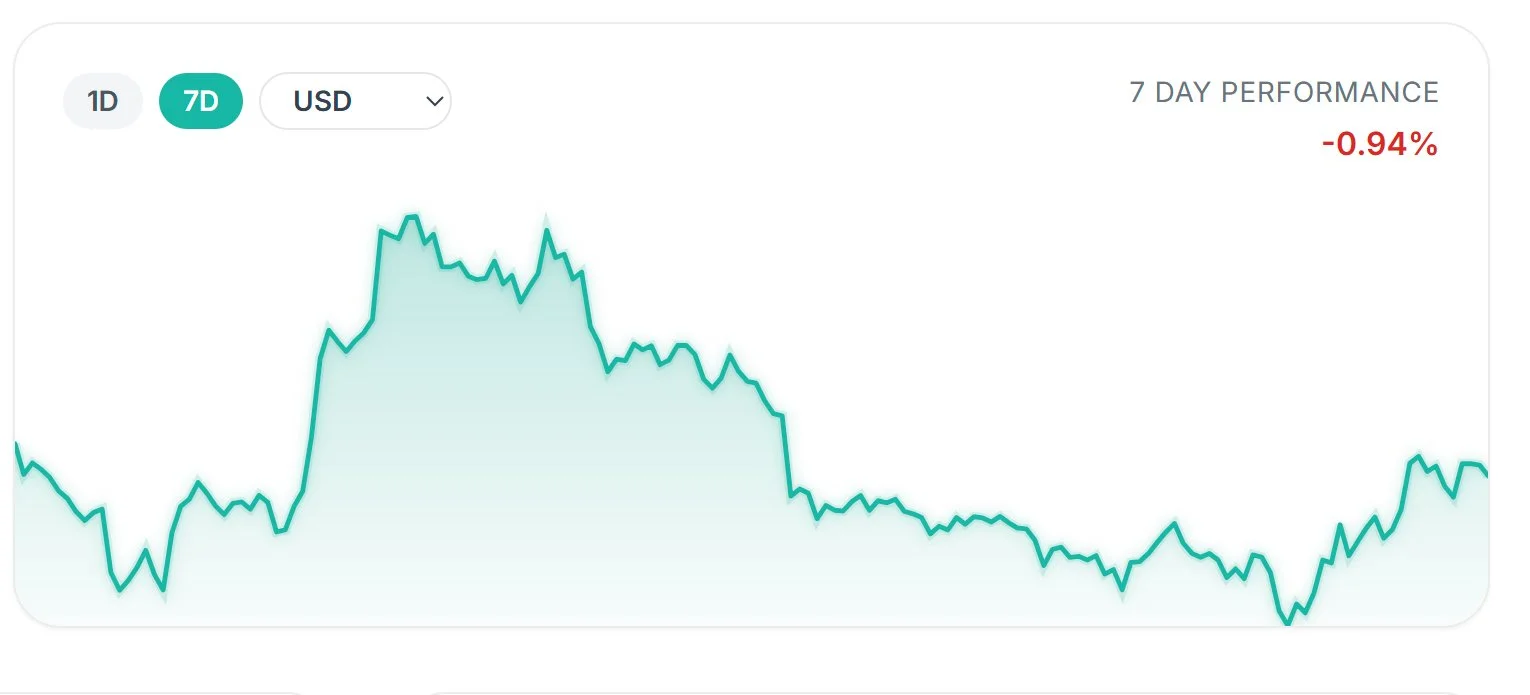
Price Chart
The price chart was implemented as a custom SVG component to maintain full control over rendering, responsiveness, and interaction. Price data from the API is normalized into coordinates within a fixed SVG viewBox, allowing the chart to scale fluidly across screen sizes while preserving consistent geometry.
For hover interaction, the mouse position (clientX) is translated from browser coordinates into chart coordinates by subtracting the chart element’s left offset (getBoundingClientRect().left). This determines the exact horizontal position of the cursor within the chart. That position is converted into a percentage of the chart’s width and mapped to the corresponding index in the dataset, allowing a vertical tracker line and marker to follow the price path in real time.
This lightweight approach replicates the behavior of professional trading interfaces while avoiding the overhead of external charting libraries.
↓
Subtract chart offset (rect.left)
↓
Position inside chart
↓
Convert to %
↓
Map to dataset index
↓
Render hover tracker
The chart supports two selectable time ranges (1D and 7D), both powered by CoinGecko’s market_chart endpoint. The API returns historical price data as timestamp–price pairs ([timestamp, price]), which are transformed into a simplified dataset before being rendered in the SVG chart component. Switching ranges simply changes the days parameter in the request, allowing the same endpoint to provide either short-term or multi-day price history.
To improve reliability and avoid API rate-limit errors, chart requests are routed through a Netlify serverless function that forwards the request to CoinGecko and returns the data with short caching applied.